In this document and accompanying video we will learn how Version 12 makes it very easy to use the Google visualization API in the UX Component by simply cutting and pasting code from the Google API documentation into our UX Component. All of the background work of loading the API is handled by Version 12.
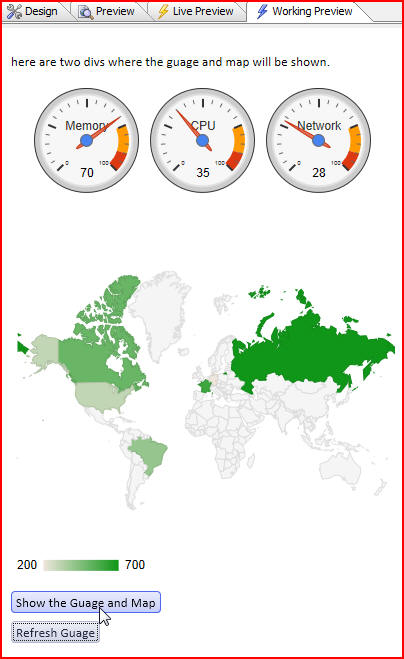
In this example we have gauges and a map displayed:
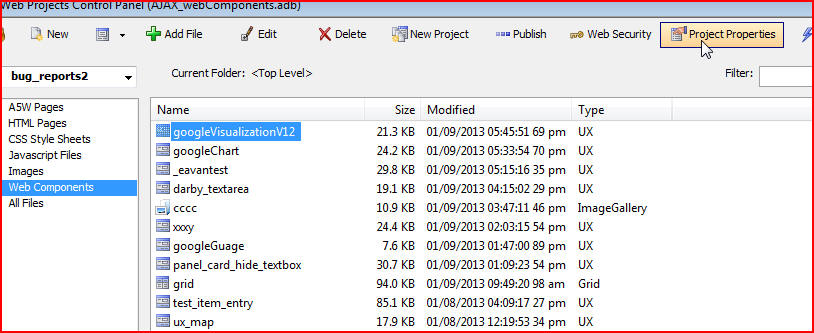
To do this we first have to load the Google Javascript API which we do by clicking on Web Project Properties:
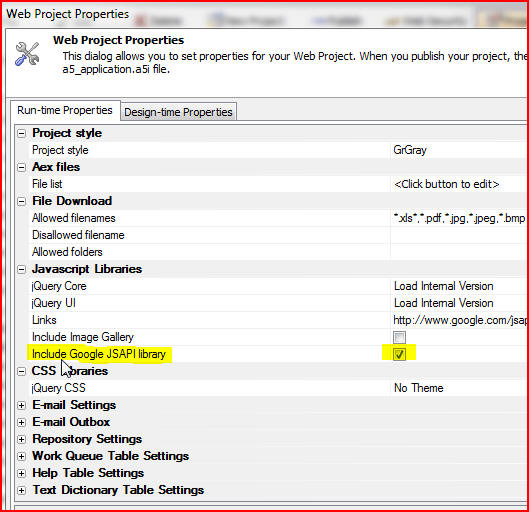
When the Web Project Properties window opens, turn on Include Google JSAPI library, a new property in Version 12:
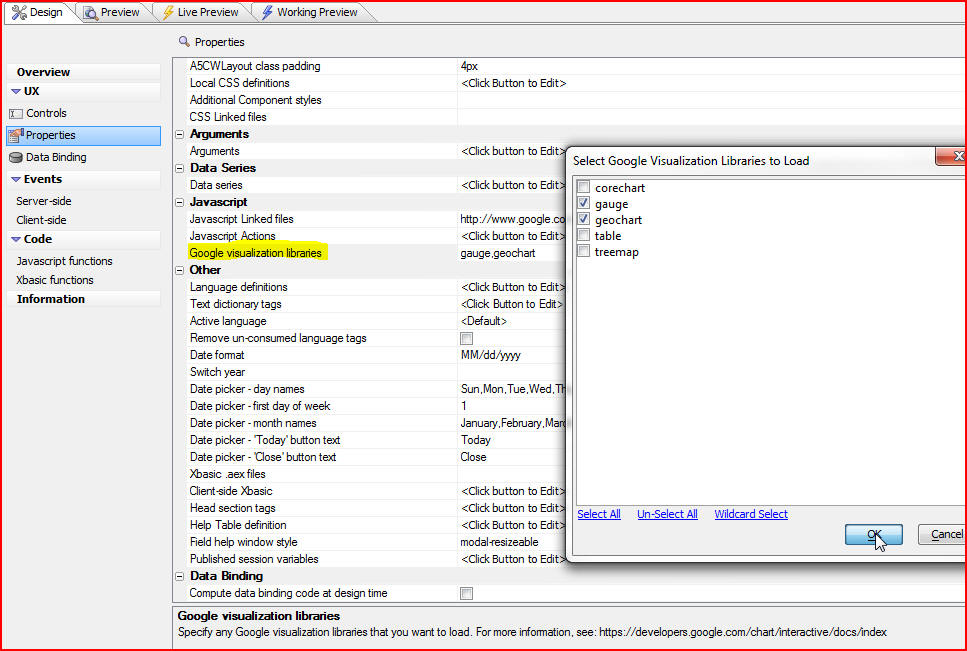
Next we click on the Design tab in our UX Component, then click Properties. Under the Javascript heading we click Google visualization libraries which will bring up the Select Google Visualization Libraries to Load window. For this example we will select gauge and geochart:
Now let's look at Google documentation by going to developers.google.com or by searching for Google Chart. In the Google documentation we click Chart Gallery to see chart styles that are available:
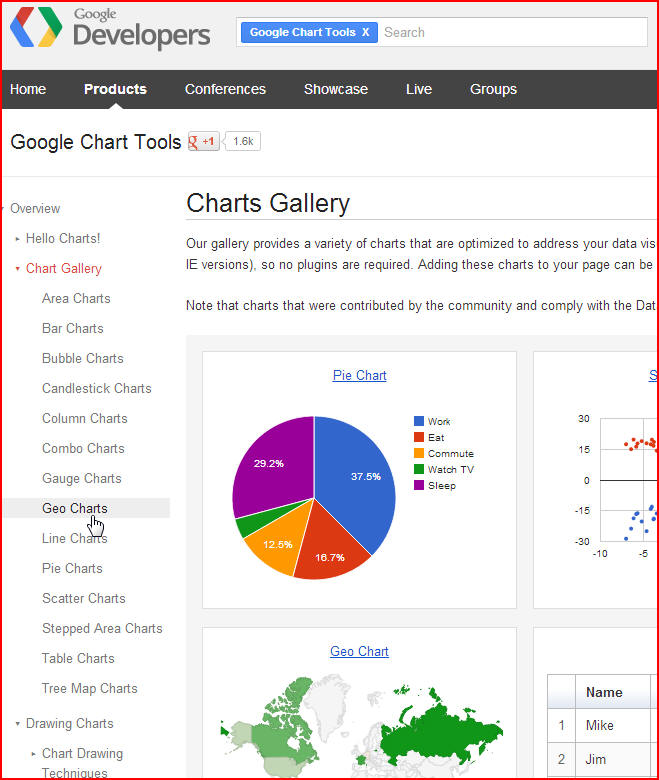
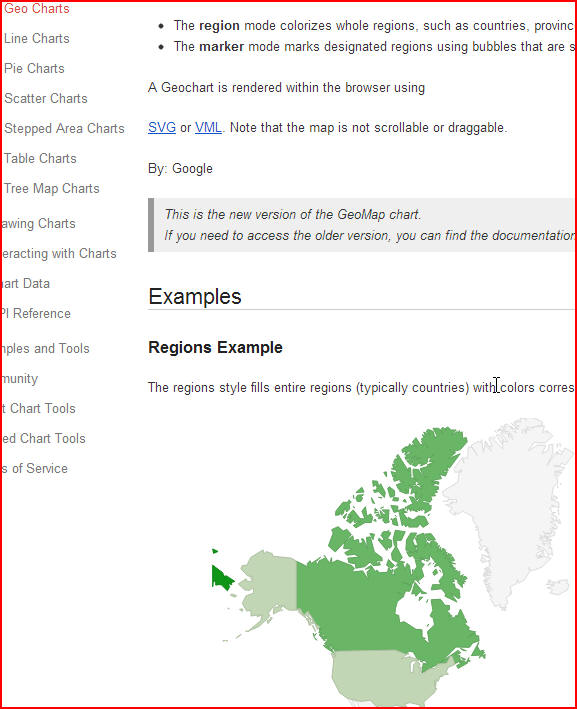
We will choose Geo Charts, and scroll down to see examples:
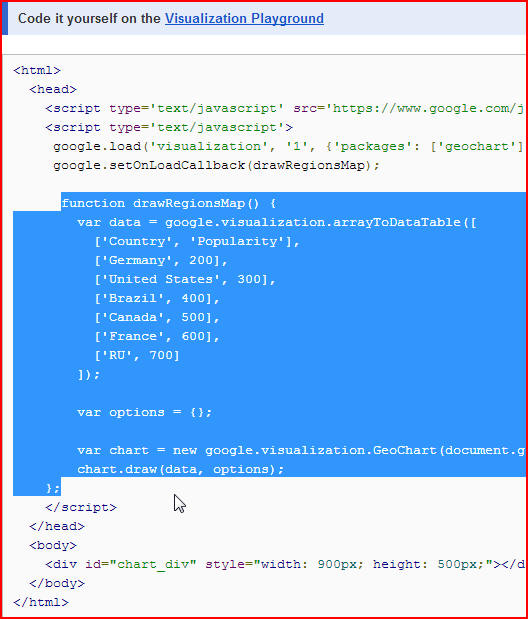
When we scroll down further we see the code used in the Geo Chart example. We will copy the code to the clipboard:
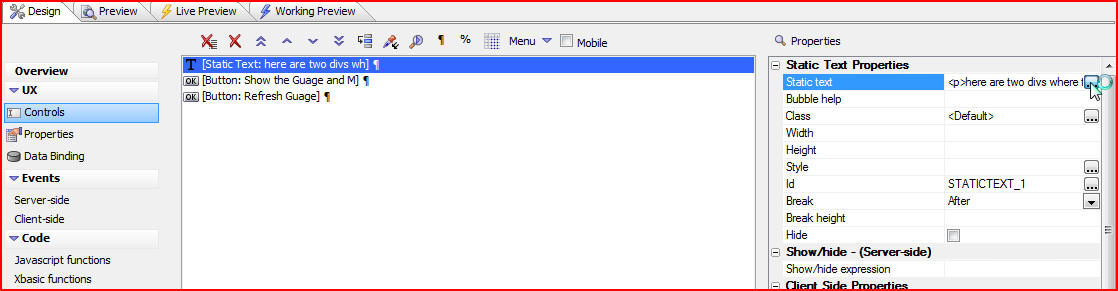
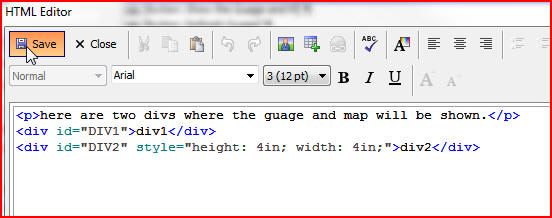
Now we can go back to our Component, click Controls and see that we have put in a Static Text area with two divs. This is where the map and gauge will be shown:
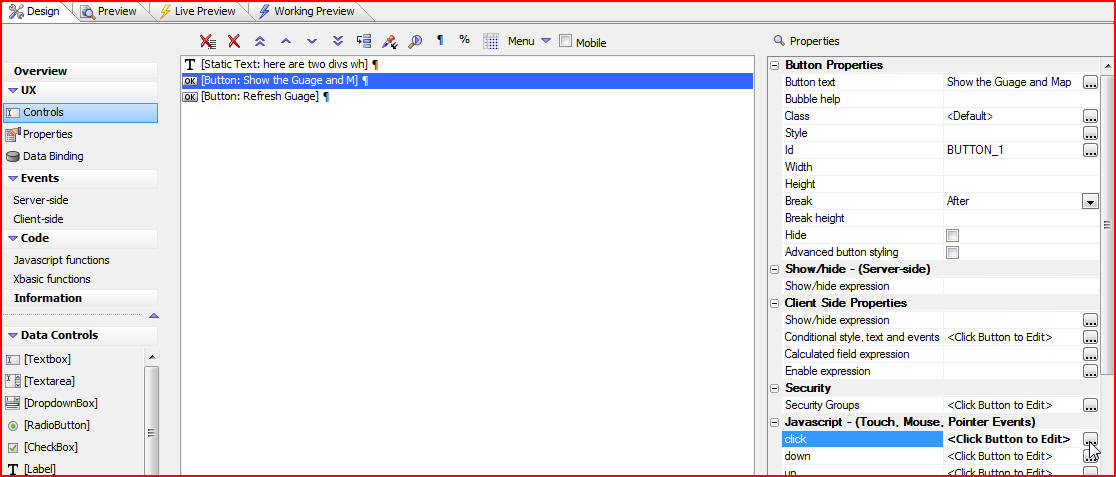
This button will display the map and the gauge. Under Javascript properties, click will show us what the on-click event does:
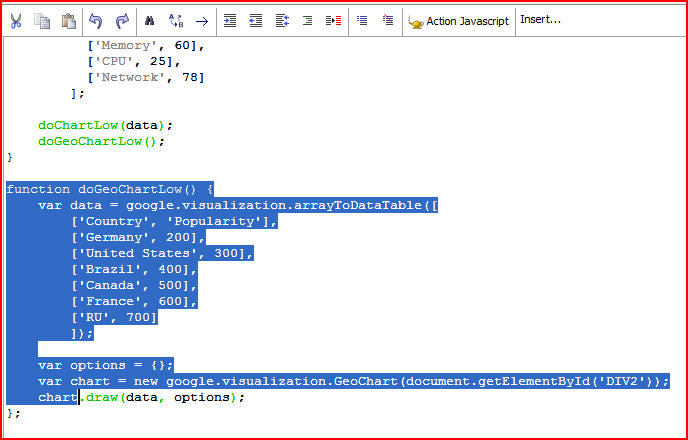
We can see that the on-click event calls in the doChart function, which defines the data series for the three gauges, and then calls in doChartLow, passing in the data series:
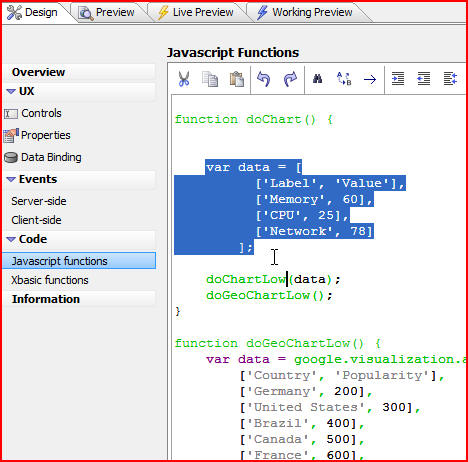
And here is the doChartLow function which will plot the data. This function was essentially copied directly from the Google API documentation:
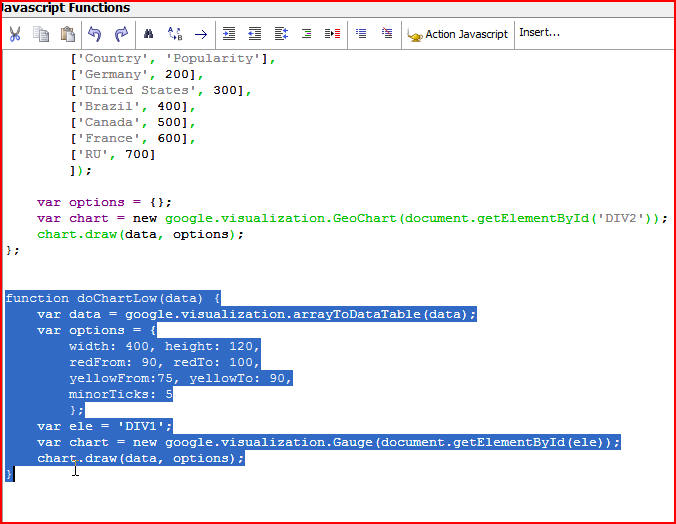
Here is the function for the map, which was also copied from the Google API documentation:
Now we run our component by clicking on the Working Preview tab, then click on the Show the Gauge and Map button:
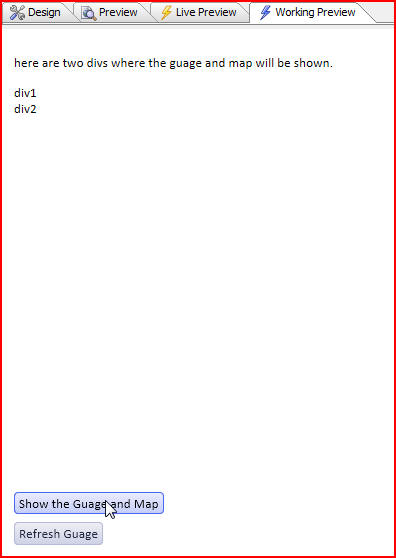
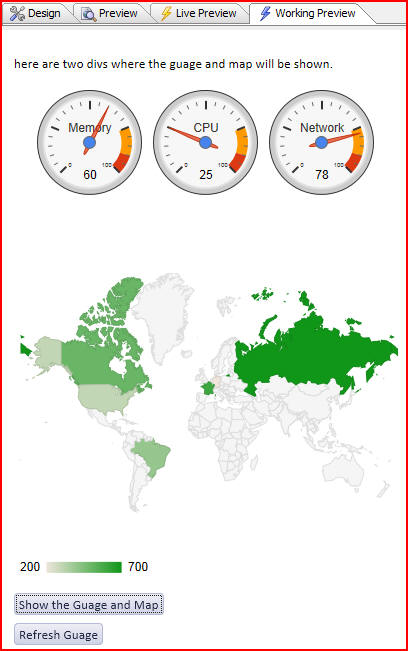
The map and gauges are displayed, and the Refresh Gauge button can be clicked to reflect new data: